
In this post I will explain how to add the Prometheus agent to the Red Hat ActiveMQ image, so that Prometheus is able to scrape queue depths from the ActiveMQ running in your Openshift environment.
Much of this blog references https://brunonetid.github.io/2017/11/27/camel-prometheus-openshift.html which explains how to add the Prometheus agent for Camel.
For this blog I have used minishift.
Building the AMQ Image Extension
We need to add the Prometheus jar into the ActiveMQ image. This code is all available at my github amq63-prom-sti repository.
Override the assemble script to move the prometheus agent lib into the $ACTIVEMQ_HOME\lib directory.
###
if [ -d ${SRCLIB} ]; then
  echo "Copying jars from project..."
  cp -v ${SRCLIB}/* $AMQ_HOME/lib/
fi
###
A default Prometheus configuration file is also added into the image which configures the agent to expose all of the queue size JMX statistics to Prometheus.
rules:
  - pattern: 'org.apache.activemq<type=(\w+), brokerName=(.*?), destinationType=(\w+), destinationName=(.*?)><>QueueSize'
    name: queue_size
    help: Queue Size
    type: GAUGE
    labels:
      destination: $4
The Openshift template then configures and extra service for prometheus and ensures that the port is exposed on the container. The template in my repository is based on the upstream template from jboss-openshift / application-templates.
In addition, the ACTIVEMQ_OPTS are in the template specifying the location of the promethus configuration file:
{
    "name": "ACTIVEMQ_OPTS",
    "value": "-javaagent:/opt/amq/lib/jmx_prometheus_javaagent-0.10.jar=9779:/opt/amq/conf/promconfig.yml"
}
In order to build the AMQ63 image with the agent built in and get it running on Openshift, use the following commands:
git clone https://github.com/welshstew/amq63-prom-sti.git
cd amq63-prom-sti
oc new-project mydemo
oc import-image jboss-amq-63 --from=registry.access.redhat.com/jboss-amq-6/amq63-openshift --confirm -n openshift
oc new-build registry.access.redhat.com/jboss-amq-6/amq63-openshift:latest~https://github.com/welshstew/amq63-prom-sti.git
oc create -f amq63-basic-prom.json
oc new-app --template=amq63-basic-prom -p MQ_QUEUES=hello1 -p IMAGE_STREAM_NAMESPACE=mydemo
At this point you should have a broker pod up and running, let’s get its name, and rsh into the pod and see the statistics that the prometheus agent is exposing. It should be seen that the ActivMQ destinations are exposed.
[user@localhost amq63-prom-sti]$ export BROKERPOD=$(oc get pods -l application=broker -o json | jq .items[0].metadata.name -r)
[user@localhost amq63-prom-sti]$ oc rsh $BROKERPOD
sh-4.2$ curl localhost:9779
# HELP jvm_classes_loaded The number of classes that are currently loaded in the JVM
# TYPE jvm_classes_loaded gauge
jvm_classes_loaded 3906.0
######## OMMITTED ######
# HELP queue_size Queue Size
# TYPE queue_size gauge
queue_size{destination="ActiveMQ.Advisory.MasterBroker",} 0.0
queue_size{destination="hello1",} 0.0
queue_size{destination="ActiveMQ.Advisory.Queue",} 0.0
######## OMMITTED ######
Deploying Prometheus
Now we need to deploy the prometheus application into the project.
git clone https://github.com/welshstew/amq63-prometheus.git
cd amq63-prometheus
oc adm policy add-cluster-role-to-user cluster-reader system:serviceaccount:mydemo:default
oc new-build --binary --name=prometheus
oc start-build prometheus --from-dir=. --follow
oc new-app prometheus
oc expose service prometheus
At this point there should be a prometheus route available on your Openshift cluster. Use oc get routes and navigate in your browser. You should be able to query for queue_size, as per the image below:
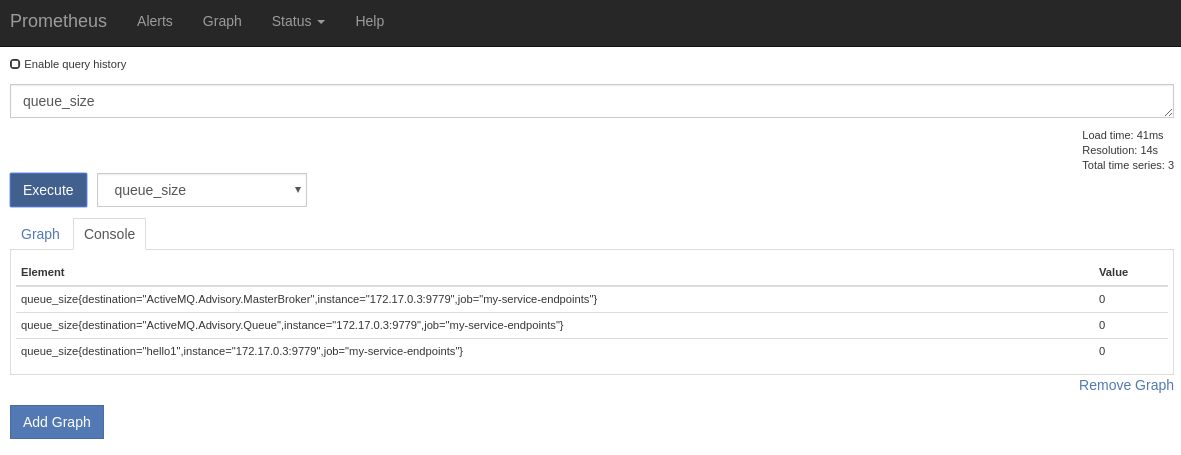
Note that the broker-amq-prom service is hardcoded into the prometheus.yml
Deploying Grafana
Now we need to deploy Grafana in order to see the queue depths graphed.
git clone https://github.com/welshstew/amq63-grafana.git
cd amq63-grafana
oc new-build --binary --name=grafana
oc start-build grafana --from-dir=. --follow
oc new-app grafana
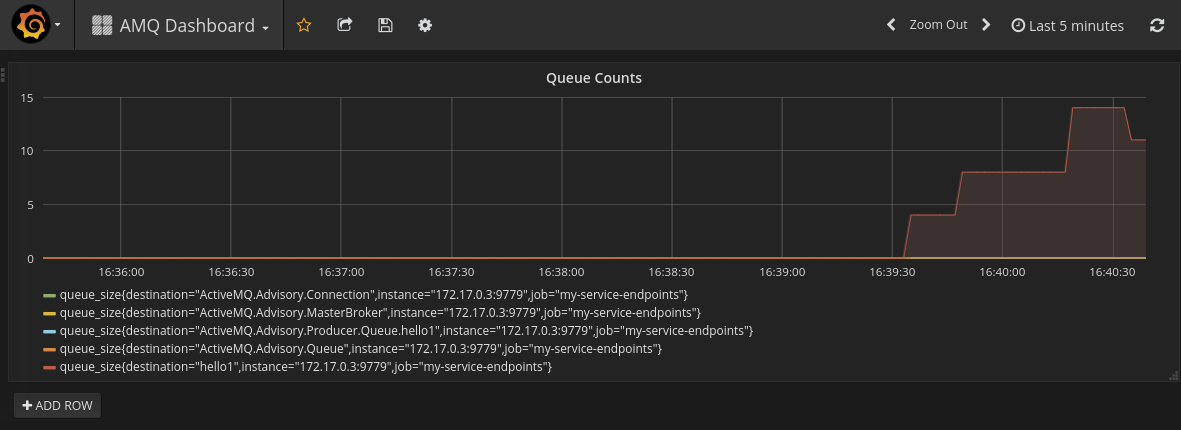
oc expose service grafanaAt this point there should be a Grafana route available on your Openshift cluster. Use oc get routes and navigate in your browser. You should be able to use Grafana and start charting your queue depths:
References
- redhat (22) ,
- java (12) ,
- camel (12) ,
- fuse (7) ,
- activemq (5) ,
- metrics (1) ,
- openshift (19) ,
- containers (19)
- redhat (25) ,
- java (14) ,
- camel (12) ,
- fuse (8) ,
- activemq (5) ,
- metrics (1) ,
- openshift (19) ,
- containers (19)
